PUBLIC HEALTH · DETROIT · LANDSAT THERMAL

Where Detroit gets too hot

A free Land Surface Temperature map of Detroit, derived from Landsat 8 thermal data. Hotter neighborhoods are where extreme summer heat hits hardest, where canopy is missing, and where tree planting saves the most lives. The map is here so anyone can see it.

01 · The map

Detroit on a hot day

Land Surface Temperature for the Detroit metro on September 9, 2025 (Landsat 8, 0.5% cloud cover). Bright yellow and white pixels are hot impervious surfaces - parking lots, factory roofs, the freeway. Dark purple and black are cool - tree canopy, parks, the Detroit River. Every pixel is 30 meters across.
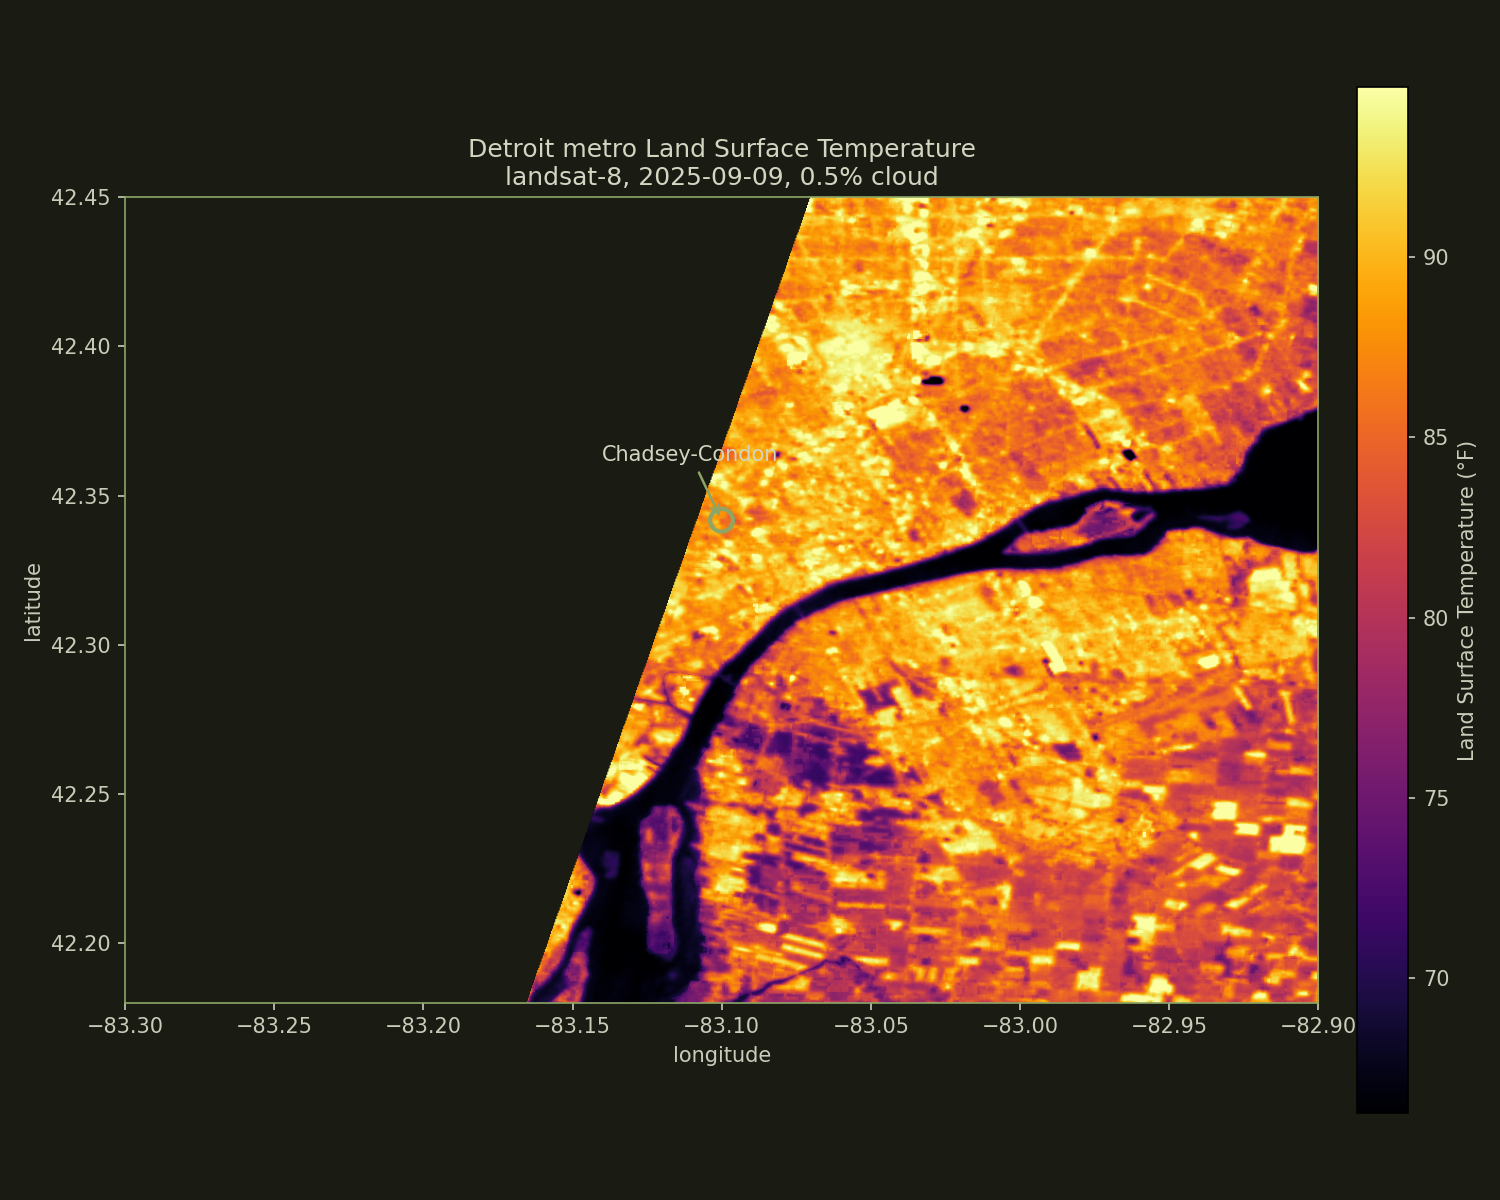
Detroit Land Surface Temperature map for September 9, 2025
Detroit metro Land Surface Temperature, °F. The Detroit River shows as the cool dark band running diagonally. Chadsey-Condon (where Dryad operates) is annotated in green.
84.6°F
Detroit metro mean LST
Landsat 8, 2025-09-09
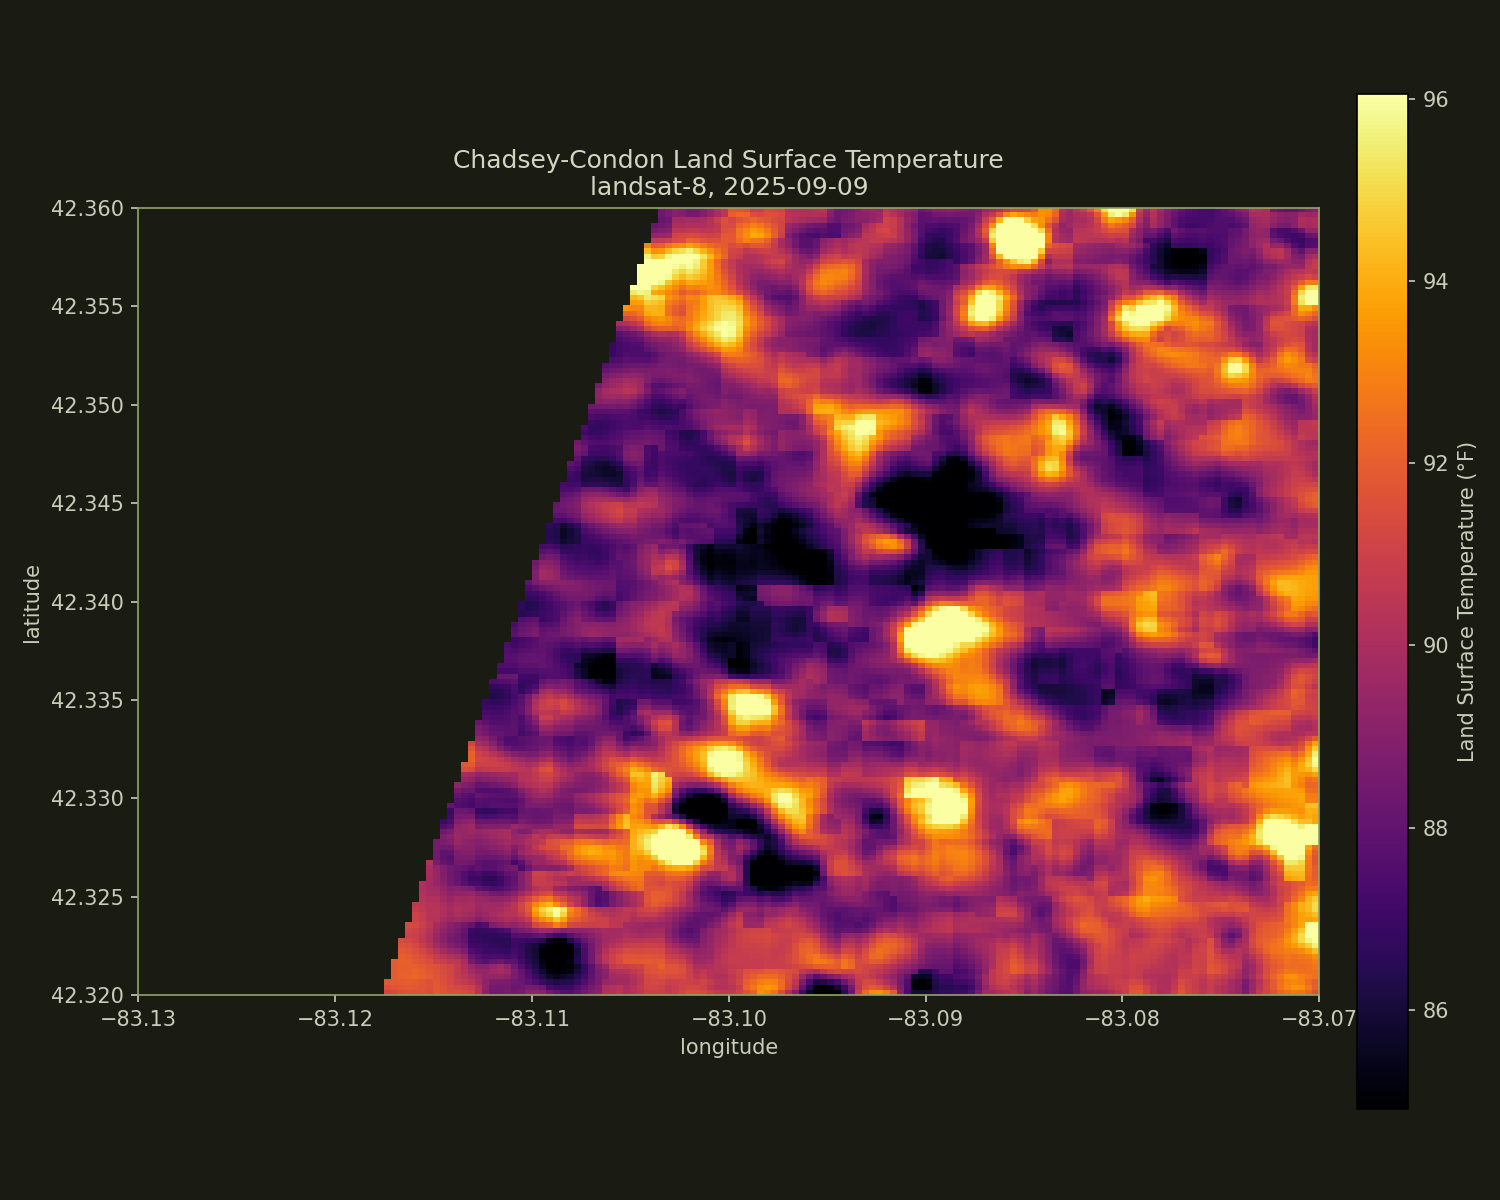
89.7°F
Chadsey-Condon mean LST
Same scene · same time
+5.1°F
Chadsey-Condon vs metro
Heat island differential
~120
Heat-related premature deaths in Detroit per year
Planet Detroit, 2025
02 · Zoom in

Chadsey-Condon, on the same day

Same Landsat scene, zoomed into the neighborhood where Dryad operates. The microstructure becomes visible: hot rooftops and parking lots in bright yellow, cool tree canopy in dark purple. The mean is 89.7°F - more than 5 degrees above the metro mean. Vacant lots without canopy run hottest.

Chadsey-Condon Land Surface Temperature closeup
Chadsey-Condon, °F. Range across this single neighborhood: ~86 to ~96°F.

The pattern is not random

The cool patches are where mature trees and small green spaces survive. The hot patches are where pavement, rooftops, and bare soil dominate. The 10°F difference within a single neighborhood is the heat island effect operating block-by-block. Tree canopy is the most cost-effective intervention; the EPA estimates urban tree planting reduces local LST by 7-9°F when canopy hits 40%+.

03 · Method

How this map was built

Free public data, free public software, no API keys required.

Source

Landsat 8 Collection 2 Level 2 surface temperature (Band 10 thermal infrared, 30 m/pixel) via Microsoft Planetary Computer. Free, open, requires no account. Refresh every ~16 days per satellite.

Pipeline

Python script (rasterio + pystac-client + matplotlib): scene search filtered for <20% cloud, summer months 2023-2026; surface temperature DN converted to Kelvin (DN × 0.00341802 + 149); rendered with the inferno colormap; stretched to robust 2/98 percentiles.

Reproducible

All code lives at github.com/vivicool12334/dryad in services/satellite-microservice/scripts/generate_heat_map.py. Same script, any city: change the bbox.

04 · So what

What to do with this

This map is data. The action it points to is canopy investment in the hottest neighborhoods. Detroit has roughly 100,000 vacant lots. Many of them sit in the brightest cells of this map. The same lots could carry trees, native prairie, and pollinator habitat - and measurably cool the surrounding blocks.

The Branas et al. (2018) PNAS randomized controlled trial on Philadelphia vacant-lot greening found a 41-69% reduction in poor mental health in low-income neighborhoods near greened lots, alongside a documented drop in violent crime. Heat reduction is the mechanism most strongly supported by satellite evidence: 7-9°F cooling at street level under mature canopy.

Dryad's piece of this

Dryad is the autonomous operator that takes nine of those vacant lots in Chadsey-Condon and converts them into permanent native habitat - a pilot for a model that could scale to thousands of lots without grant cycles, volunteer burnout, or annual budget fights. Read about Dryad · Technical docs · Ask Dryad